Now updated for Terracotta 3.3!
With Terracotta's latest 3.2 release, configuring 2nd Level Cache for Hibernate is incredibly simple. What's more is that using the included Hibernate console, we can identify the hot spots in our application, and eliminate unwanted database activity.
In this blog I will show you how to setup and install Terracotta EHCache for Hibernate into the venerable Spring PetClinic application. After that we will identify where database reads can be converted to cache reads. By the end of the tutorial, we will convert all database reads into cache reads, demonstrating 100% offload of the database.
What you'll need:
- Java 1.5 or greater
- Ant
- Tomcat
Let's get started.
Step 1 - Download and unzip the Spring PetClinic Application
Go to the
Spring download site and download Spring 2.5.6 SEC01 with dependencies. Of course you can download other versions, but 2.5.6 SEC01 is the version I used for this tutorial.
Unzip the installation into $SPRING_HOME.
Step 2 - Build PetClinic for use with Hibernate
The PetClinic application is location in $SPRING_HOME/samples/petclinic. Cd to this directory.
The first thing we need to do is setup PetClinic to use Hibernate. To do so, update the web.xml file located in src/war/WEB-INF/web.xml. Locate the section called contextConfigLocation and update it to look like the following (comment out the JDBC config file and un-comment out the hibernate config file):
<context-param>
    <param-name>contextConfigLocation</param-name>
    <param-value>/WEB-INF/applicationContext-hibernate.xml</param-value>
    <!-- <param-value>/WEB-INF/applicationContext-jdbc.xml</param-value>
    <param-value>/WEB-INF/applicationContext-jpa.xml</param-value<  -->
    <!--  To use the JPA variant above, you will need to enable Spring load-time
                  weaving in your server environment. See PetClinic's readme and/or
                  Spring's JPA documentation for information on how to do this.  -->
    </context-param>
Now, build the application:
$ ant warfile
...
BUILD SUCCESSFUL
Total time: 20 seconds
Step 3 - Start PetClinic
First, start the HSQLDB database:
$ cd db/hsqldb
$ ./server.sh
Next, copy the WAR file to your Tomcat's webapps directory:
$ cp dist/petclinic.war $TOMCAT_HOME/webapps
And start Tomcat:
$ $TOMCAT_HOME/bin/catalina.sh start
...
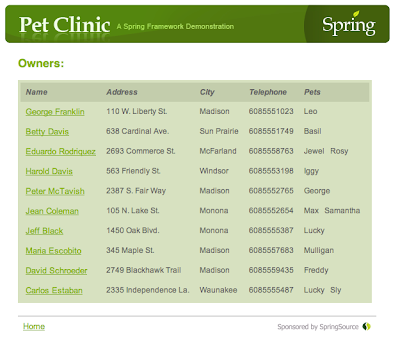
You should now be able to access PetClinic at
http://localhost:8080/petclinic and see the home screen:

Step 4 - Install Terracotta
Download Terracotta from the
http://www.terracotta.org/download. Unzip and install into $TC_HOME
Step 5 - Configure Spring PetClinic Application to use Ehcache as a Hibernate Second Level Cache
First, the Terracotta Ehcache libraries must be copied to the WEB-INF/lib directory so they can be compiled into the PetClinic WAR file. The easiest way to do this is to update the build.xml file that comes with Spring PetClinic. Add two properties to the top of the build file (make sure to replace PATH_TO_YOUR_TERRACOTTA with your actual path):
<property name="tc.home" value="PATH_TO_YOUR_TERRACOTTA" />
<property name="ehcache.lib" value="${tc.home}/ehcache/lib" />
Then, update the lib files section - locate the section that starts with the comment "copy Tomcat META-INF", adding the Terracotta hibernate jars like so:
<!-- copy Tomcat META-INF -->
<copy todir="${weblib.dir}" preservelastmodified="true">
  <fileset dir="${tc.home}/lib">
      <include name="terracotta-toolkit*.jar">
  </include>
  </fileset>
  <fileset dir="${ehcache.lib}">
      <include name="ehcache*.jar">
  </include>
  </fileset>
  ...
</copy>
The Sprint PetClinic application by default includes Ehcache libraries, but we are setting up the application to use the latest version of Ehcache. Therefore you should also remove the sections in this file that copy the ehcache libraries to the WAR file:
<!--
            <fileset dir="${spring.root}/lib/ehcache">
            <include name="ehcache*.jar"/>
        </fileset>
        -->
Note: there are two such entries, make sure to update them both!You'll also need to update the applicationContext.xml file, located in war/WEB-INF/applicationContext-hibernate.xml. This is the Spring configuration file, and it contains the properties that configure Hibernate. We need to update the 2nd level cache provider settings so Hibernate will use Terracotta. Update the HibernateSessionFactory like so:
<!-- Hibernate SessionFactory -->
      <bean id="sessionFactory" class="org.springframework.orm.hibernate3.LocalSessionFactoryBean" ref="dataSource" mappingresources="petclinic.hbm.xml">
              <property name="hibernateProperties">
                      <props>
                              <prop key="hibernate.dialect">${hibernate.dialect}</prop>
                              <prop key="hibernate.show_sql">${hibernate.show_sql}</prop>
                              <prop key="hibernate.generate_statistics">${hibernate.generate_statistics}</prop>
                              <prop key="hibernate.cache.use_second_level_cache">true</prop>
                              <prop key="hibernate.cache.region.factory_class">net.sf.ehcache.hibernate.EhCacheRegionFactory</prop>
                      </props>
              </property>
              <property name="eventListeners">
                      <map>
                              <entry key="merge">
                                      <bean class="org.springframework.orm.hibernate3.support.IdTransferringMergeEventListener">
                              </bean></entry>
                      </map>
              </property>
      </bean>
As written, the Spring PetClinic application entities are not configured for caching. Each entity configuration in Hibernate requires caching to be explicitly enabled before caching is available. To enable caching, open the petclinic.hbm.xml file located in src/petclinic.hbm.xml and add caching entries to each entity definition. Here are the entity definitions I used:
<class name="org.springframework.samples.petclinic.Vet" table="vets">
    <cache usage="read-write"/>
    ....
</class>
<class name="org.springframework.samples.petclinic.Specialty" table="specialties">
    <cache usage="read-only"/>
    ....
</class>
<class name="org.springframework.samples.petclinic.Owner" table="owners">
    <cache usage="read-write"/>
    ....
</class>
<class name="org.springframework.samples.petclinic.Pet" table="pets">
    <cache usage="read-write"/>
    ....
</class>
<class name="org.springframework.samples.petclinic.PetType" table="types">
    <cache usage="read-only"/>
    ....
</class>
<class name="org.springframework.samples.petclinic.Visit" table="visits">
    <cache usage="read-write"/>
    ....
</class>
Step 6 - Rebuild and re-deploy
Now that the PetClinic app is configured for use with Terracotta and Hibernate 2nd level cache, re-build the war file and re-deploy it to your tomcat installation:
$ ant warfile
...
BUILD SUCCESSFUL
Total time: 20 seconds
$ $TOMCAT_HOME/bin/catalina.sh stop
$ rm -rf $TOMCAT_HOME/webapps/petclinic
$ cp dist/petclinic.war $TOMCAT_HOME/webapps
Note: Do not start Tomcat yet!Step 7 - Start Terracotta
During the integration process you will want to have the Terracotta Developer Console running at all times. It will help you diagnose problems, and provide detailed statistics about Hibernate usage. Start it now:
$ $TC_HOME/bin/dev-console.sh
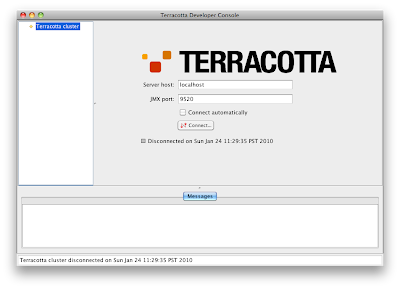
If the "Connect Automatically" box is not checked, check it now.
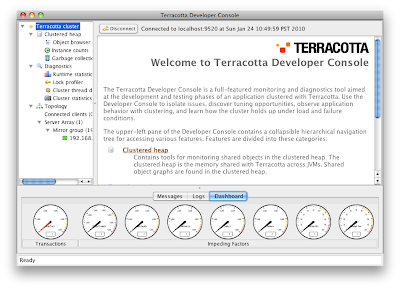
Now you will need to start the Terracotta server:
$ $TC_HOME/bin/start-tc-server.sh
Your Developer Console should connect to the server and you should now see:
Step 8 - Start Tomcat and PetClinic with Caching
$ $TOMCAT_HOME/bin/catalina.sh start
Now access the PetClinic app again at
http://localhost:8080/petclinic. Take a look at the Developer Console. It should indicate one client has connected - this is the PetClinic app. Your Developer Console should look like this:

If it does not, please review Steps 1-8.
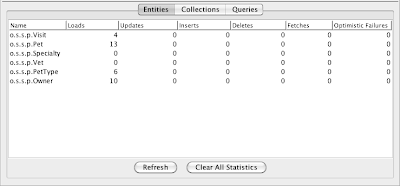
It's now time to review our application. Click the "Hibernate" entry in the Developer Console. You should now see the PetClinic entities listed. As you access entities in the application, the statistics in the Developer Console will reflect that access. Select "Refresh" to see an up to date view of the statistics.
Step 9 - Analyze Cache Performance
Now we can use the Developer Console to monitor the cache performance.
Select the "Second-Level Cache" button from the upper right hand corner. To monitor performance in real-time you can use either the Overview tab or the Statistics tab.
In the Spring PetClinic app, select "Find owner" from the main menu. You should see the following screen:
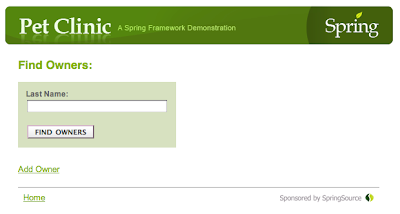
Now find all owners by pressing the "FIND OWNERS" button. Without any parameters in the query box, this will search for and display all owners. The results should look like this:
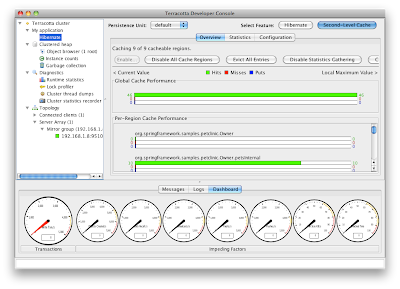
If you are using the Overview tab, you will see the cache behavior in real-time. Refresh the find owners page (re-send the form if your browser asks) and then quickly switch to the Developer Console. You should see something like the following:
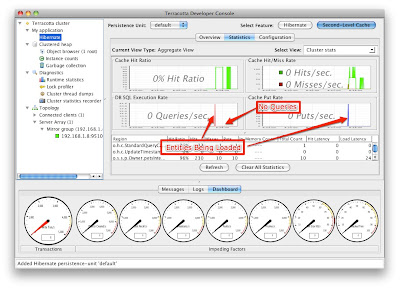
Try switching tabs to the Statistics tab and do the same thing. Notice that in the statistics tab, you get a history of the recent activity. After finding the owners again your screen should like the following:
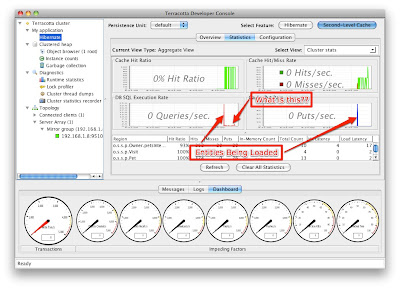
Notice that there is a graph labeled "DB SQL Execution Rate". This graph shows exactly how many SQL statements are being sent to the database from Terracotta. This is a feature unique to Terracotta, because Terracotta adds special instrumentation into Hibernate that allows it to detect the DB SQL statements being sent to the DB. Let's use this feature to eliminate all database reads.
Step 10 - Eliminate all database activity
By using the Developer Console we can see that we've eliminated almost all of the activity that we can reasonably expect. Of course we cannot eliminate the initial cache load, as the data must get into the cache somehow. So what are the little blips of database activity occurring after the initial load?
The application activity that is causing the database activity is that of repeatedly listing all of the owners. Is it possible that this is causing our database activity - even though we've already cached all of the owners?
Indeed, this is the case. To generate the list of owners, Hibernate must issue a query to the database. Once the result set is generated (a list of entity ids) all of the reads can subsequently be satisfied from cache. We can confirm that this is the case using the Developer Console - If you suspect that it can show you statistics on queries then you are starting to understand how the Developer Console works and what it can do for you!
To see Hibernate query statistics, select the "Hibernate" button in the upper-right corner. Then select the "Queries" tab. This will show you the queries that are being performed by Hibernate. If we do so now, sure enough, just as we expected, we can see an entry for our Owner query:
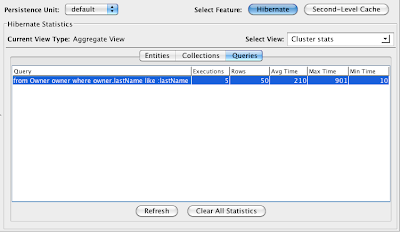
If we refresh our owner list again, and press "Refresh" on the query statistics, we should see the number in the Executions column increase by one. In my case, you see the number 5 in the previous screenshot. After reloading the owner query and refreshing the statistics page, I see the number 6.
Step 11 - Enable Query Caching
Is there a way to eliminate these database queries? Yes, there is, it is called the Query Cache. To learn more about the query cache I highly recommend you read these resources:
In short, the query cache can cache the results of a query, meaning that Hibernate doesn't have to go back to the database for every "list owners" request we make. Does it make sense to turn this caching on? Not always, as Alex points out (make sure you read his article).
Because our goal today is to eliminate all database reads, we are going to turn on query caching. Whether you should do so or not for your application will depend on many factors, so make sure you fully understand the role of the query cache and how to use it.
To enable query caching, we have to do two things:
- Enable query caching in the hibernate config file
- Enable caching for each query
This isn't very different than how we enabled caching for entities, with one exception. To enable caching for each query, unfortunately we have to modify the code where the query is created.
So, to enable query caching in the hibernate config file, edit the applicationContext-hibernate.xml file again and add the hibernate.cache.use_query_cache prop:
<!-- Hibernate SessionFactory -->
<bean id="sessionFactory" class="org.springframework.orm.hibernate3.LocalSessionFactoryBean" ref="dataSource" mappingresources="petclinic.hbm.xml">
    <property name="hibernateProperties">
        <props>
            <prop key="hibernate.dialect">${hibernate.dialect}</prop>
            <prop key="hibernate.show_sql">${hibernate.show_sql}</prop>
            <prop key="hibernate.generate_statistics">${hibernate.generate_statistics}</prop>
            <prop key="hibernate.cache.use_second_level_cache">true</prop>
            <prop key="hibernate.cache.provider_class">org.terracotta.hibernate.TerracottaHibernateCacheProvider</prop>
            <prop key="hibernate.cache.use_query_cache">true</prop>
        </props>
    </property>
    <property name="eventListeners">
        <map>
            <entry key="merge">
            <bean class="org.springframework.orm.hibernate3.support.IdTransferringMergeEventListener">
            </bean></entry>
        </map>
    </property>
</bean>
Now, edit the source code. There is just one file to edit, located in src/org/springframework/samples/petclinic/hibernate/HibernateClinic.java. This file contains the definitions for all the queries. Edit it to add "setCacheable(true)" to each query like so:
public class HibernateClinic implements Clinic {
      @Autowired
      private SessionFactory sessionFactory;
      @Transactional(readOnly = true)
      @SuppressWarnings("unchecked")
      public Collection >vet> getVets() {
              return sessionFactory.getCurrentSession().createQuery("from Vet vet order by vet.lastName, vet.firstName").setCacheable(true).list();
      }

      @Transactional(readOnly = true)
      @SuppressWarnings("unchecked")
      public Collection <pettype> getPetTypes() {
              return sessionFactory.getCurrentSession().createQuery("from PetType type order by type.name").setCacheable(true).list();
      }

     public Collection<owner> findOwners(String lastName) {
              return sessionFactory.getCurrentSession().createQuery("from Owner owner where owner.lastName like :lastName").setString("lastName", lastName + "%").setCacheable(true).list();
}
Now re-build and re-deploy.
Look in the Developer Console under the Second Level Cache/Statistics graph. There should be 0 DB executions (except the initial load).
Conclusion
I hope this tutorial was useful. Using caching in your application can improve performance and scale dramatically. If you'd like to review some performance numbers that Terracotta has published I recommend you visit
Terracotta's EHCache site and look in the right hand margin for a whitepaper that shows the results of performance testing the Spring PetClinic application.