Sunday, June 13, 2010

Configuring a Grails App for Clustering using Ehcache

Clustering Grails using Ehcache is very easy. Here is how to do it in just a few simple steps.

Requirements:
1) Grails 1.3.1 installed. Download Grails here if you don't already have it installed.
2) Terracotta 3.2.1 installed. Download Terracotta here if you don't already it installed.

This post assumes you have Grails installed to $GRAILS_HOME and Terracotta installed to $TERRACOTTA_HOME.

Before setting up your application for clustering, we'll need a Grails app. If you don't already have a Grails app, let's create one. We just repeat the steps listed on the Grails Quick Start Page. I will create a simple application called "Events" which create and stores events:

Step 1. Create the application

$ grails create-app events

Step 2. Create a domain class

grails create-domain-class Event

Edit the generated Event domain class grails-app/domain/events/Event.groovy and add some fields to it:

package events
class Event {
Date date
String title
}

Step 3. Create a controller

$ grails create-controller Event

Edit the grails-app/controllers/events/EventController.groovy to implement default scaffolding:

package events

class EventController {
def scaffold = Event
}

Step 4. Run the app

$ grails run-app

And browse to http://localhost:8080/events/event

Now we have a complete Grails application. Let's add Terracotta:

Step 5. Configure your domain class for caching

You will need to tell Hibernate that your domain class is cacheable. Edit the domain class at grails-app/domain/events/Event.groovy and add the cache directive:

package events

class Event {
static mapping = {
cache true
}

Date date
String title
}

Step 6. Configure Grails to use the latest version of Ehcache with Terracotta support built-in

Edit the config file at grails-app/conf/BuildConfig.groovy. Update the section which imports the default global settings like so to update the depencencies to the latest version of Ehcache (sidenote, Ehcache version 2.1.0 depends on Terracotta version 3.2.1, don't get confused by the version numbers - they don't line up because the two products are different even if owned by the same company):

grails.project.dependency.resolution = {
// inherit Grails' default dependencies
inherits( "global" ) {
// uncomment to disable ehcache
// excludes 'ehcache'
runtime 'net.sf.ehcache:ehcache-core:2.1.0'
runtime 'net.sf.ehcache:ehcache-terracotta:2.1.0'
}

<rest of file here>

Step 7. Configure Ehcache to use Terracotta.

By default Ehcache caches are not configured for Terracotta support. Enable this by overriding the built-in Ehcache defaults by adding the file grails-app/conf/ehcache.xml with the following contents:

<ehcache name="EventCache">
<defaultCache
maxElementsInMemory="10"
eternal="false"
timeToIdleSeconds="120"
timeToLiveSeconds="120"
overflowToDisk="false">
<terracotta/>
</defaultCache>
&;t'terracottaConfig url="localhost:9510"/>
</ehcache>

Step 8. Start a Terracotta Server

Terracotta requires that a Server is running. Start it now:

$ $TERRACOTTA_HOME/bin/start-tc-server.sh

Step 9. Start a developer console

To observe caching in action, start a Terracotta Developer Console:

$ $TERRACOTTA_HOME/bin/dev-console.sh

Step 10. Run the app again

$ grails run-app

You can monitor the cache stats in the Terracotta Developer Console. To do so, make sure you turn on statistics gathering:
  1. Click on Ehcache
  2. Click on Statistics
  3. Find the "Enable Statistics" button and click it

The following screen shot shows where to click:


Now, navigate to the application at http://localhost:8080/events/event. Create an event. After creating the event, you are left on a page that views the event. Press "Refresh" on your browser a few times, and notice that you get activity in the Developer Console Statistics window.

Here's what it should look like:


That's it - have fun with clustered Ehcache for Grails!

Sunday, January 24, 2010

Tutorial - Integrating Terracotta EHCache for Hibernate with Spring PetClinic

Now updated for Terracotta 3.3!

With Terracotta's latest 3.2 release, configuring 2nd Level Cache for Hibernate is incredibly simple. What's more is that using the included Hibernate console, we can identify the hot spots in our application, and eliminate unwanted database activity.

In this blog I will show you how to setup and install Terracotta EHCache for Hibernate into the venerable Spring PetClinic application. After that we will identify where database reads can be converted to cache reads. By the end of the tutorial, we will convert all database reads into cache reads, demonstrating 100% offload of the database.

What you'll need:

  • Java 1.5 or greater
  • Ant
  • Tomcat
Let's get started.

Step 1 - Download and unzip the Spring PetClinic Application

Go to the Spring download site and download Spring 2.5.6 SEC01 with dependencies. Of course you can download other versions, but 2.5.6 SEC01 is the version I used for this tutorial.

Unzip the installation into $SPRING_HOME.

Step 2 - Build PetClinic for use with Hibernate

The PetClinic application is location in $SPRING_HOME/samples/petclinic. Cd to this directory.

The first thing we need to do is setup PetClinic to use Hibernate. To do so, update the web.xml file located in src/war/WEB-INF/web.xml. Locate the section called contextConfigLocation and update it to look like the following (comment out the JDBC config file and un-comment out the hibernate config file):
<context-param>
<param-name>contextConfigLocation</param-name>
<param-value>/WEB-INF/applicationContext-hibernate.xml</param-value>
<!-- <param-value>/WEB-INF/applicationContext-jdbc.xml</param-value>
<param-value>/WEB-INF/applicationContext-jpa.xml</param-value< -->
<!-- To use the JPA variant above, you will need to enable Spring load-time
weaving in your server environment. See PetClinic's readme and/or
Spring's JPA documentation for information on how to do this. -->
</context-param>
Now, build the application:
$ ant warfile
...
BUILD SUCCESSFUL
Total time: 20 seconds

Step 3 - Start PetClinic

First, start the HSQLDB database:
$ cd db/hsqldb
$ ./server.sh
Next, copy the WAR file to your Tomcat's webapps directory:
$ cp dist/petclinic.war $TOMCAT_HOME/webapps
And start Tomcat:
$ $TOMCAT_HOME/bin/catalina.sh start
...

You should now be able to access PetClinic at http://localhost:8080/petclinic and see the home screen:


Step 4 - Install Terracotta

Download Terracotta from the http://www.terracotta.org/download. Unzip and install into $TC_HOME

Step 5 - Configure Spring PetClinic Application to use Ehcache as a Hibernate Second Level Cache

First, the Terracotta Ehcache libraries must be copied to the WEB-INF/lib directory so they can be compiled into the PetClinic WAR file. The easiest way to do this is to update the build.xml file that comes with Spring PetClinic. Add two properties to the top of the build file (make sure to replace PATH_TO_YOUR_TERRACOTTA with your actual path):
<property name="tc.home" value="PATH_TO_YOUR_TERRACOTTA" />
<property name="ehcache.lib" value="${tc.home}/ehcache/lib" />
Then, update the lib files section - locate the section that starts with the comment "copy Tomcat META-INF", adding the Terracotta hibernate jars like so:
<!-- copy Tomcat META-INF -->
<copy todir="${weblib.dir}" preservelastmodified="true">
<fileset dir="${tc.home}/lib">
<include name="terracotta-toolkit*.jar">
</include>
</fileset>
<fileset dir="${ehcache.lib}">
<include name="ehcache*.jar">
</include>
</fileset>
...
</copy>
The Sprint PetClinic application by default includes Ehcache libraries, but we are setting up the application to use the latest version of Ehcache. Therefore you should also remove the sections in this file that copy the ehcache libraries to the WAR file:
<!--
<fileset dir="${spring.root}/lib/ehcache">
<include name="ehcache*.jar"/>
</fileset>
-->
Note: there are two such entries, make sure to update them both!

You'll also need to update the applicationContext.xml file, located in war/WEB-INF/applicationContext-hibernate.xml. This is the Spring configuration file, and it contains the properties that configure Hibernate. We need to update the 2nd level cache provider settings so Hibernate will use Terracotta. Update the HibernateSessionFactory like so:
<!-- Hibernate SessionFactory -->
<bean id="sessionFactory" class="org.springframework.orm.hibernate3.LocalSessionFactoryBean" ref="dataSource" mappingresources="petclinic.hbm.xml">
<property name="hibernateProperties">
<props>
<prop key="hibernate.dialect">${hibernate.dialect}</prop>
<prop key="hibernate.show_sql">${hibernate.show_sql}</prop>
<prop key="hibernate.generate_statistics">${hibernate.generate_statistics}</prop>
<prop key="hibernate.cache.use_second_level_cache">true</prop>
<prop key="hibernate.cache.region.factory_class">net.sf.ehcache.hibernate.EhCacheRegionFactory</prop>
</props>
</property>
<property name="eventListeners">
<map>
<entry key="merge">
<bean class="org.springframework.orm.hibernate3.support.IdTransferringMergeEventListener">
</bean></entry>
</map>
</property>
</bean>
As written, the Spring PetClinic application entities are not configured for caching. Each entity configuration in Hibernate requires caching to be explicitly enabled before caching is available. To enable caching, open the petclinic.hbm.xml file located in src/petclinic.hbm.xml and add caching entries to each entity definition. Here are the entity definitions I used:
<class name="org.springframework.samples.petclinic.Vet" table="vets">
<cache usage="read-write"/>
....
</class>
<class name="org.springframework.samples.petclinic.Specialty" table="specialties">
<cache usage="read-only"/>
....
</class>
<class name="org.springframework.samples.petclinic.Owner" table="owners">
<cache usage="read-write"/>
....
</class>
<class name="org.springframework.samples.petclinic.Pet" table="pets">
<cache usage="read-write"/>
....
</class>
<class name="org.springframework.samples.petclinic.PetType" table="types">
<cache usage="read-only"/>
....
</class>
<class name="org.springframework.samples.petclinic.Visit" table="visits">
<cache usage="read-write"/>
....
</class>

Step 6 - Rebuild and re-deploy

Now that the PetClinic app is configured for use with Terracotta and Hibernate 2nd level cache, re-build the war file and re-deploy it to your tomcat installation:
$ ant warfile
...
BUILD SUCCESSFUL
Total time: 20 seconds
$ $TOMCAT_HOME/bin/catalina.sh stop
$ rm -rf $TOMCAT_HOME/webapps/petclinic
$ cp dist/petclinic.war $TOMCAT_HOME/webapps

Note: Do not start Tomcat yet!

Step 7 - Start Terracotta

During the integration process you will want to have the Terracotta Developer Console running at all times. It will help you diagnose problems, and provide detailed statistics about Hibernate usage. Start it now:
$ $TC_HOME/bin/dev-console.sh
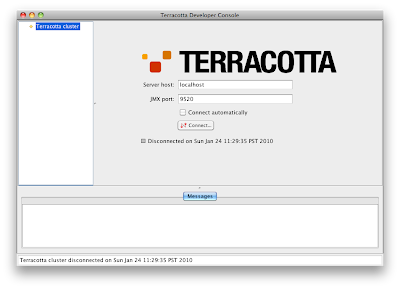


If the "Connect Automatically" box is not checked, check it now.

Now you will need to start the Terracotta server:
$ $TC_HOME/bin/start-tc-server.sh
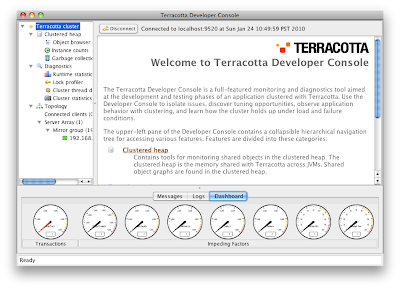
Your Developer Console should connect to the server and you should now see:


Step 8 - Start Tomcat and PetClinic with Caching

$ $TOMCAT_HOME/bin/catalina.sh start


Now access the PetClinic app again at http://localhost:8080/petclinic. Take a look at the Developer Console. It should indicate one client has connected - this is the PetClinic app. Your Developer Console should look like this:


If it does not, please review Steps 1-8.

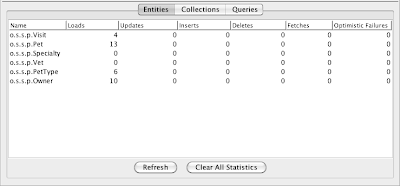
It's now time to review our application. Click the "Hibernate" entry in the Developer Console. You should now see the PetClinic entities listed. As you access entities in the application, the statistics in the Developer Console will reflect that access. Select "Refresh" to see an up to date view of the statistics.

Step 9 - Analyze Cache Performance

Now we can use the Developer Console to monitor the cache performance.

Select the "Second-Level Cache" button from the upper right hand corner. To monitor performance in real-time you can use either the Overview tab or the Statistics tab.

In the Spring PetClinic app, select "Find owner" from the main menu. You should see the following screen:
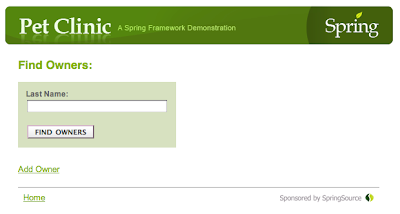


Now find all owners by pressing the "FIND OWNERS" button. Without any parameters in the query box, this will search for and display all owners. The results should look like this:
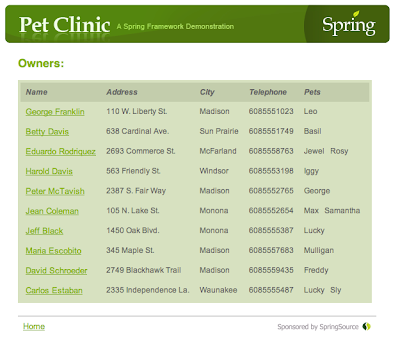


If you are using the Overview tab, you will see the cache behavior in real-time. Refresh the find owners page (re-send the form if your browser asks) and then quickly switch to the Developer Console. You should see something like the following:
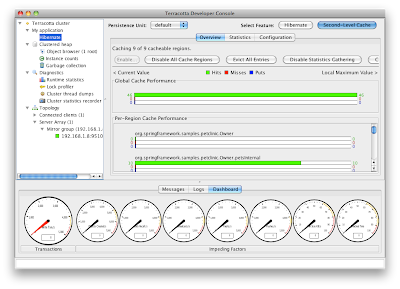


Try switching tabs to the Statistics tab and do the same thing. Notice that in the statistics tab, you get a history of the recent activity. After finding the owners again your screen should like the following:
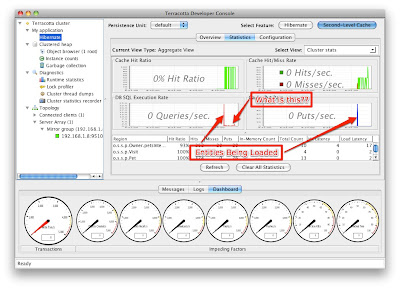


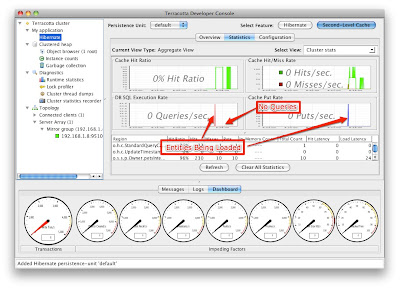
Notice that there is a graph labeled "DB SQL Execution Rate". This graph shows exactly how many SQL statements are being sent to the database from Terracotta. This is a feature unique to Terracotta, because Terracotta adds special instrumentation into Hibernate that allows it to detect the DB SQL statements being sent to the DB. Let's use this feature to eliminate all database reads.

Step 10 - Eliminate all database activity

By using the Developer Console we can see that we've eliminated almost all of the activity that we can reasonably expect. Of course we cannot eliminate the initial cache load, as the data must get into the cache somehow. So what are the little blips of database activity occurring after the initial load?

The application activity that is causing the database activity is that of repeatedly listing all of the owners. Is it possible that this is causing our database activity - even though we've already cached all of the owners?

Indeed, this is the case. To generate the list of owners, Hibernate must issue a query to the database. Once the result set is generated (a list of entity ids) all of the reads can subsequently be satisfied from cache. We can confirm that this is the case using the Developer Console - If you suspect that it can show you statistics on queries then you are starting to understand how the Developer Console works and what it can do for you!

To see Hibernate query statistics, select the "Hibernate" button in the upper-right corner. Then select the "Queries" tab. This will show you the queries that are being performed by Hibernate. If we do so now, sure enough, just as we expected, we can see an entry for our Owner query:
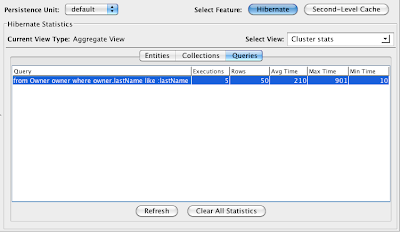


If we refresh our owner list again, and press "Refresh" on the query statistics, we should see the number in the Executions column increase by one. In my case, you see the number 5 in the previous screenshot. After reloading the owner query and refreshing the statistics page, I see the number 6.

Step 11 - Enable Query Caching

Is there a way to eliminate these database queries? Yes, there is, it is called the Query Cache. To learn more about the query cache I highly recommend you read these resources:

In short, the query cache can cache the results of a query, meaning that Hibernate doesn't have to go back to the database for every "list owners" request we make. Does it make sense to turn this caching on? Not always, as Alex points out (make sure you read his article).

Because our goal today is to eliminate all database reads, we are going to turn on query caching. Whether you should do so or not for your application will depend on many factors, so make sure you fully understand the role of the query cache and how to use it.

To enable query caching, we have to do two things:
  • Enable query caching in the hibernate config file
  • Enable caching for each query

This isn't very different than how we enabled caching for entities, with one exception. To enable caching for each query, unfortunately we have to modify the code where the query is created.
So, to enable query caching in the hibernate config file, edit the applicationContext-hibernate.xml file again and add the hibernate.cache.use_query_cache prop:
<!-- Hibernate SessionFactory -->
<bean id="sessionFactory" class="org.springframework.orm.hibernate3.LocalSessionFactoryBean" ref="dataSource" mappingresources="petclinic.hbm.xml">
<property name="hibernateProperties">
<props>
<prop key="hibernate.dialect">${hibernate.dialect}</prop>
<prop key="hibernate.show_sql">${hibernate.show_sql}</prop>
<prop key="hibernate.generate_statistics">${hibernate.generate_statistics}</prop>
<prop key="hibernate.cache.use_second_level_cache">true</prop>
<prop key="hibernate.cache.provider_class">org.terracotta.hibernate.TerracottaHibernateCacheProvider</prop>
<prop key="hibernate.cache.use_query_cache">true</prop>
</props>
</property>
<property name="eventListeners">
<map>
<entry key="merge">
<bean class="org.springframework.orm.hibernate3.support.IdTransferringMergeEventListener">
</bean></entry>
</map>
</property>
</bean>
Now, edit the source code. There is just one file to edit, located in src/org/springframework/samples/petclinic/hibernate/HibernateClinic.java. This file contains the definitions for all the queries. Edit it to add "setCacheable(true)" to each query like so:

public class HibernateClinic implements Clinic {
@Autowired
private SessionFactory sessionFactory;
@Transactional(readOnly = true)
@SuppressWarnings("unchecked")
public Collection >vet> getVets() {
return sessionFactory.getCurrentSession().createQuery("from Vet vet order by vet.lastName, vet.firstName").setCacheable(true).list();
}

@Transactional(readOnly = true)
@SuppressWarnings("unchecked")
public Collection <pettype> getPetTypes() {
return sessionFactory.getCurrentSession().createQuery("from PetType type order by type.name").setCacheable(true).list();
}

public Collection<owner> findOwners(String lastName) {
return sessionFactory.getCurrentSession().createQuery("from Owner owner where owner.lastName like :lastName").setString("lastName", lastName + "%").setCacheable(true).list();
}

Now re-build and re-deploy.

Look in the Developer Console under the Second Level Cache/Statistics graph. There should be 0 DB executions (except the initial load).


Conclusion


I hope this tutorial was useful. Using caching in your application can improve performance and scale dramatically. If you'd like to review some performance numbers that Terracotta has published I recommend you visit Terracotta's EHCache site and look in the right hand margin for a whitepaper that shows the results of performance testing the Spring PetClinic application.

Tuesday, January 19, 2010

XTP Processing using a Distributed SEDA Grid built with Coherence

I just finished a talk at the NYC Coherence SIG January 14, 2010.


The topic highlights the concepts Grid Dynamics used to build a high throughput scalable XTP engine for processing telecommunications billing events. The framework employs a distributed SEDA architecture built on top of a Coherence In-Memory-Data-Grid back-end.

Sunday, January 03, 2010

Characterizing Enterprise Systems using the CAP theorem

In mid 2000, Eric A. Brewer, a former founder of Inktomi and chief scientist at Yahoo! and now currently a professor of Computer Science at U.C. Berkeley, presented a keynote speech at the ACM Symposium on the Principles of Distributed Computing. In his seminal speech, Brewer described a theorem based on research and observations he made called the CAP theorem.


The CAP theorem is based on the observation that a distributed system is governed by three fundamental characteristics:

  1. Consistency
  2. Availability
  3. Partition tolerance


CAP is a is a useful tool in understanding the behavior of a distributed system. It states that given the three fundamental characteristics of a distributed computing system, you may have any two but never all three. It's usefulness in designing and building distributed systems cannot be overstated. So, how can we use the knowledge of this theorem to our advantage?


As the designer of an enterprise scale system, CAP provides us with a framework to make decisions regarding which tradeoffs must be made in our own implementations. But CAP allows us not only to understand the systems we are building more precisely, but also provides a framework by which we can classify all systems. It is thus an invaluable tool when evaluating the systems that we rely on day in and day out in our enterprise systems.


As an example, let's analyze the traditional Relational Database Management System (RDBMS). The RDBMS, arguably one of the most successful enterprise technologies in history, has been around in its current form for nearly 40 years! The primary reason for the staying power of the RDBMS lies with its ability to provide consistency. A consistent system is most easily understood and reasoned about, and therefore most readily adopted (thus explaining the popularity of the RDBMS). But what of the other properties? An RDBMS provides availability, but only when there is connectivity between the client accessing the RDBMS and the RDBMS itself. Thus it can be said that the RDBMS does not provide partition tolerance - if a partition arises between the client and the RDBMS, the system will not be able to function properly. In summary, we can thus characterize the RDBMS as a CA system due to the fact that it provides Consistency and Availability but not Partition tolerance.


As useful as this mechanism is, we can go one step further. Given that a system will always lack one of C, A, or P, it is common that mature systems have evolved a means of partially recovering the lost CAP characteristic. In the case of our RDBMS example, there are several well-known approaches that can be employed to compensate for the lack of Partition tolerance. One of these approaches is commonly referred to as master/slave replication. In this scheme, database writes are directed to a specially designated system, or master. Data from the master is then replicated to one or more additional, or slave, systems. If the master is offline then reads may be failed over to any one of the surviving read replica slaves.


Thus, in addition to characterizing systems by their CAP traits, we can further characterize them by identifying the recovery mechanism(s) they provide for the lacking CAP trait. In the remainder of this article I classify a number of popular systems in use today in enterprise, and non-enterprise, distributed systems. These systems are:

  • RDBMS
  • Amazon Dynamo
  • Terracotta
  • Oracle Coherence
  • GigaSpaces
  • Cassandra
  • CouchDB
  • Voldemort
  • Google BigTable

RDBMS

CAP: CA

Recovery Mechanisms: Master/Slave replication, Sharding


RDBMS systems are fundamentally about providing availability and consistency of data. The gold standard of RDMBS updates, referred to as ACID, governs the way in which consistent updates are recorded and persisted.


Various means of improving RDBMS performance are available in commercial systems. Due to the maturity of the RDBMS, these mechanisms are well understood. For example, the consistency conflicting reads and writes during the course of a transaction is referred to as isolation levels. The commonly accepted set of isolation levels, in decreasing order of consistency (and increasing order of performance), are:

  • SERIALIZABLE
  • REPEATABLE READ
  • READ COMMITTED
  • READ UNCOMMITTED


Recovery mechanisms:

  • Master/Slave replication: A single master accepts writes, data is replicated to slaves. Data read from slaves may be slightly out of date, trading off some amount of Consistency to provide Partition tolerance.
  • Sharding: While not strictly limited to database systems, sharding is commonly used in conjunction with a database system. Sharding refers to the practice of separating the entire application into vertical slices which are 100% independent of one another. Once completed, sharding isolates failures of any one system into "swimlanes" and is one example of "fault isolative architectures", thus limiting the impact of any single failure or related sets of failure to only one portion of an application. Sharding provides some measure of resistance to Partition tolerance by assuming that failures occur on a small enough scale to be isolated to a single shard, leaving the remaining shards operational.

Amazon Dynamo

CAP: AP

Recovery: Read-repair, application hooks


Amazon's Dynamo is a private system designed and used solely by Amazon. Dynamo was intentionally designed to provide Availability and Partitioning tolerance, but not Consistency. This appearance of Amazon's Dynamo was very nearly as seminal as the introduction of the CAP theorem itself. Due to the dominance of the database, until Amazon introduced Dynamo to the world, it was very nearly a mainstay that enterprise systems must provide Consistency and therefore the tradeoffs available lie in the remaining two CAP characteristics of Availability or Partition tolerance.


Examining the requirements for Amazon's Dynamo, it's clear why the designers chose to buck the trend: Amazon's business model depends heavily on availability. Even the simplest of estimates pegs the losses Amazon could suffer from an outage at a minimum of $30,000 per minute. Given that Amazon's growth has nearly quadrupled since these estimates were made (in 2008), we can estimate that in 2010 Amazon may lose as much as $100,000 per minute. Put simply, availability matters a lot at Amazon. Furthermore, the fallacies of distributed computing already know tells us that the network is unreliable, and so therefore we must expect partitions to occur on a regular and frequent basis. So it's a simple matter then to see that the only remaining CAP characteristic left to sacrifice is Consistency.


Dynamo provides an eventual consistency model, where all nodes will eventually get all updates during their lifetime.

Given a system composed of N nodes, the eventual consistency model is tuned as follows:

  • Setting the number of writes needed for a successful write operation (W).
  • Setting the number of reads needed for a successful write operation (R).

Setting W = N or R = N will give you a quorum-like system with strict consistency and no partition tolerance. Setting W <>


Given that different nodes may have different versions of the same value (i.e., a value may have been written during a node downtime), Dynamo needs to:

  • Track versions and resolve conflicts.
  • Propagate new values.
Versioning is implemented by using vector clocks: each value is associated to a list of (node, value) pairs updated every time a specific node writes that value; they can be used to determine causal ordering and branching. Conflict resolution is done during reads (read repair), eventually merging values with diverging vector clocks and writing back.

New values are propagated by using hinted handoff and merkle trees.


Terracotta

CAP: CA

Recovery: Quorum vote, majority partition survival


Terracotta is a Java-based distributed computing platform that provides high level features such as Caching via EHCache and highly available scheduling via Quartz. Additional support for Hibernate second level caching allows architects to easily adopt Terracotta in a standard JEE architecture that relies on Spring, Hibernate and an RDBMS.


Terracotta's architecture is similar to that of a database. Clients connect to one or more servers arranged into a "Server Array" layer. Updates are always Consistent in a Terracotta cluster, and availability is guaranteed so long as no partitions exist in the topology.


Recovery Mechanisms:

  • Quorum: Upon failure of a single server, a backup server may take over once it has received enough votes from cluster members to elect itself the new master.
  • Majority partition survival: In the event of a catastrophic partition involving many members of a Terracotta cluster that divides the cluster into one or more non-communicative partitions, the partition with a majority of remaining nodes is allowed to continue after a pre-configured period of time elapses.

Oracle Coherence

CAP: CA

Recovery: Partitioning, Read-replicas


Oracle Coherence is an in-memory Java data-grid and caching framework. It's main architectural component is its ability to provide consistency (hence it's name). All data in Oracle Coherence has at most one home. Data may be replicated to a configurable number of additional members in the cluster. When a system fails, replica systems vote on who becomes the new home for data that was homed in the failed system.


Coherence provides data-grid features that facilitate processing data using map-reduce like techniques (execute the work on the data, instead of moving data to the processing) and a host of distributed computing patterns are available in the incubator patterns.


Recovery Mechanism(s):

  • Data Partitioning: At a granular level, any one piece of data exhibits CA properties, that is to say that reads and writes of data in Coherence are always Consistent. As long as no partitions exist, data is available, meaning that for a particular piece of data, Coherence is not Partition tolerant. However, similar to the database sharding mechanism data may be partitioned across the cluster nodes, meaning that a partition will only affect a sub-set of all data.
  • Read-replication: Coherence caches may be configured in varying topologies. When a Coherence cache is configured in read-replicated mode it exhibits CA. Data is consistent but writes block in the face of partitions.


GigaSpaces

CAP: CA or AP, depending on the replication scheme chosen

Recovery: Per-key data partitioning


GigaSpaces is a Java based application server that is fundamentally built around the notion of Space-based computing, an idea derived from Tuple Spaces which was the core foundation of the Linda programming system.


GigaSpaces provides high availability of data placed in the space by means of synchronous and an asynchronous replication scheme.


In a synchronous replication mode, GigaSpaces provides Consistency and Availability. The system is consistent and available, but can not tolerate partitions. In an asynchronous replication mode, GigaSpaces provides Availability and Partition tolerance. The system is available for reads and writes, but is only eventually consistent (after the asynchronous replication completes).


Recovery Mechanism(s):

  • Per-key data partitioning - GigaSpaces supports a mode called Partitioned-Sync2Backup. This allows for data to be partitioned based on a key to lower the risk of shared fate and to provide a synchronous copy for recovery.


Apache Cassandra

CAP: AP

Recovery: Partitioning, Read-repair


Apache Cassandra was developed by Facebook, using the same principles as Amazon's Dynamo, thus it is no surprise that Cassandra's CAP traits are the same as Dynamo's.


For read-recovery, Cassandra uses simple timestamps instead of the more difficult vector clocks implementation used by Amazon's Dynamo.


Recovery Mechanism(s):

  • Partitioning
  • Read-repair


Apache CouchDB

CAP: AP

Recovery:


Apache CouchDB is a document oriented database that is written in Erlang.


Voldemort

Link: http://project-voldemort.com

CAP: AP

Recovery: Configurable read-repair


Project Voldemort is an open-source distributed key value store developed by LinkedIn and released as open source in February of 2009. Voldemort exhibits similar characteristics as Amazon's Dynamo. It uses vector clocks for version detection and read-repair.


Recovery Mechanism(s):

  • Read-repair with versioning using vector clocks.


Google BigTable

CAP: CA

Recovery:


Google's BigTable is, according to Wikipedia, "a sparse, distributed multi-dimensional sorted map", sharing characteristics of both row-oriented and column-oriented databases." It relies on Google File System (GFS) for data replication.


This blog post is still a work in progress. There are many other systems that are worthwhile to evaluate, among them Terrastore, Erlang based frameworks like Mnesia, and message based systems such as Scala Actors, and Akka, among others. If you would like to see something else, please mention it in the comments.

Thanks also go to Sergio Bossa for assistance in writing this blog post.

Thursday, October 01, 2009

A simple load test in Terracotta...

This is a response to the following blog in which the author wrote a micro-benchmark and got some pretty bad results using Terracotta http://zion-city.blogspot.com/2009/10/terracotta-as-distributed-dbms-bad-idea.html.

Since the commenting system on blogger doesn't allow code, I am posting the response on my blog with code attached for reference.

So my approach was to try replicate the author's implementation, to see what kind of performance a straightforward micro-benchmark might achieve.

Reader beware - micro-benchmarks are never a good idea, and not usually indicative of real-world performance. In this case, based on real-world results I have seen, my results appear to be a lower bound for the kind of performance one should expect since the test isn't concurrent and is running on a single machine - hardly the kind of environment a real world clustered app would exist in)

So, with that said, I wrote a simple load test against a ConcurrentHashMap, and put 100,000 objects into it.

My results show:
Avg TPS: ~3,000
Instantaneous TPS as high as: ~7,000

Here's the code:

import java.util.Date;
import java.util.Map;
import java.util.concurrent.*;

public class Main
{
static Map<Integer, Foo> map =
new ConcurrentHashMap<Integer, Foo>();

public static class Foo
{
public String name;
public String name2;
public String name3;

public Foo(String name)
{
this.name = name;
this.name2 = name + " 2";
this.name3 = name + " 3";
}
}

public static void main(String[] args)
{
long start = System.currentTimeMillis();

for (int i = 0; i < 100000; i++) {
map.put(i, new Foo(new Date().toString()));
}
System.out.println("elapsed: " + (System.currentTimeMillis() - start));
}
}


And here's the tc-config.xml:
<?xml version="1.0" encoding="UTF-8"?>
<tc:tc-config xmlns:tc="http://www.terracotta.org/config"
xmlns:xsi="http://www.w3.org/2001/XMLSchema-instance"
xsi:schemaLocation="http://www.terracotta.org/schema/terracotta-5.xsd">
<application>
<dso>
<instrumented-classes>
<include>
<class-expression>Main$Foo</class-expression>
</include>
</instrumented-classes>
<roots>
<root>
<field-name>Main.map</field-name>
</root>
</roots>
</dso>
</application>
</tc:tc-config>


I took a screenshot of the dev console running during the test, to give you an idea of the instantaneous TPS achieved:

Wednesday, September 02, 2009

Great customer service in the cloud

It's interesting to see providers moving to and, by proxy, the rest of us relying on, the cloud.

I just spent a few hours at VMWorld, and judging by the size, sophistication, and variety of providers, vendors, products, and companies, virtualization technologies, and in particular, cloud computing, is here to stay.

Today, Google apologized for it's GMail outage yesterday, with a completely forthright, mature, and encouraging response.


Gmail's web interface had a widespread outage earlier today, lasting about 100 minutes. We know how many people rely on Gmail for personal and professional communications, and we take it very seriously when there's a problem with the service. Thus, right up front, I'd like to apologize to all of you — today's outage was a Big Deal, and we're treating it as such. <read the rest of Google's post...>


And, in a twist of fate, just a few days ago I received an email from Netflix. Apparently they had some trouble with their network while I was trying to watch a tv show using my XBox 360. Not only did they figure this out, but they sent me an email that offered to discount my monthly fee by 3%. This is fantastic customer service! Here's the email in it's entirety:


We're sorry you may have had trouble watching instantly via your Xbox

Dear Taylor,

Last night, you may have had trouble instantly watching movies or TV episodes via your Xbox due to technical issues.

We are sorry for the inconvenience this may have caused. If you were unable to instantly watch a movie or TV episode last night via your Xbox, click on this account specific link in the next 7 days to apply your 3% credit on your next billing statement. Credit can only be applied once.

Again, we apologize for any inconvenience, and thank you for your understanding. If you need further assistance, please call us at 1-866-923-0898.

-The Netflix Team


Failures do happen. And today's scaled-out architectures are designed to be resilient to these failures. But the fact is that even though these designs exist, and are generally very resilient against failures, giving these services availability times numbered in the 9's, mistakes in design, implementation, or execution still do happen.

I say, give these guys massive cred for owning up to their mistakes, and dealing with the consumer in an open and honest way. That's the way to build solid relationships, and I for one will not look twice when Yahoo! or Blockbuster sends me that next request to join up on their service. These guys have it figured out, and have sold me as lifelong* customer, even if they're not perfect.

If only legacy infrastructure (power, cable (grrr Comcast), telephone (AT&T - I'm looking at you)) and the like could understand the value in this approach.

* lifelong in tech years, which is only about 5 years or so ;-)

Wednesday, June 17, 2009

How To Optimize Performance (or how to do Performance Testing right)

Optimizing performance requires you to performance test.

I'm just going to say it - performance testing is hard. Really hard.

Ask anyone that's done it before, and they will agree. If you haven't done it before, well, yeah, sorry. It's not easy. But you've got to do it anyway - because the most important thing you will do as a software engineer is performance test. It's a bit like when your Dad told you "when you grow up to be my age <insert age old wisdom here>" and you didn't believe him?

And now you're old enough that you realize, hey, the guy might have had a point?

Yeah, trust me. Performance testing is both the hardest, and most important, thing you will ever do in your software engineering career. Get it right - you'll be a rockstar. Don't do it - well, I promise you, you'll always be griping about why the amazing software you write is never actually used for "production" apps.

So here you go, simple steps to performance engineering:

1) Set goals - what are you trying to accomplish
2) Measure a baseline
3) Identify a bottleneck
4) Fix said bottleneck
5) Repeat until you meet your performance goals

Did I miss anything? Ahhh...yes. TAKE NOTES.

Let's try again:


1) Set goals - what are you trying to accomplish
1a) Take notes
2) Measure a baseline
2a) Take notes
3) Identify a bottleneck
3a) Take notes
4) Fix said bottleneck
4a) Take notes
5) Repeat until you meet your performance goals

Step 6) -- Report to your boss how much better your application is. But because of Step 1, you'll be able to tell him/her why it matters, right? :)

Friday, April 24, 2009

Terracotta and Spring - Powering High Throughput JEE Applications

Recently, Terracotta did a webinar with Spring founder Colin Sampaleanu.

The webinar starts out by covering the benefits that a Spring+Hibernate+Terracotta application can deliver for your Java JEE application. The latter half is dedicated to running through a reference application that provides a solid starting point as you explore all that Terracotta+Spring can provide.

Examinator

The application demonstrated in the webinar is called "Examinator", and was jointly developed by SpringSource and Terracotta. Briefly,

Examinator is a full stack reference application which demonstrates with code how to build a higly scalable, highly available application using Spring, Hibernate and Terracotta


Highlights include:
  • Frameworks: Spring MVC, Spring Security, Spring Web Flow, Hibernate

  • Scale: 16 application servers, 20,000 concurrent users

  • Latency: Max of 5 ms response time

Find out more

For a full-length recording of the Webinar available for free visit http://terracottech.webex.com.

For a complete reference—everything you need to know including full documentation, how install and run Examinator— visit http://www.terracotta.org.

You can also access a live demo of Examinator at reference.terracotta.org.

SpringOne 2009

Speaking of Spring, I'll be attending the Terracotta booth at SpringOne Europe 2009 this coming week (April 27-29, 2009) in Amsterdam. Stop by if you're attending.

Wednesday, April 22, 2009

A simple tip for new Terracotta users - always run the Terracotta Developer Console

With the release of Terracotta 3.0, I hope many of you have or are considering checking out Terracotta to see if it can help with scalability and availability of your Java application.

Of course www.terracotta.org - in particular the tutorials section with many simple recipes for exploring the many uses of Terracotta is a good place to get started.

But before you do any of that, I'd like to point out a best practice for learning and working with Terracotta. So, here's my tip for whenever you are working with Terracotta:

TIP: ALWAYS RUN THE TERRACOTTA DEVELOPER CONSOLE

It's easy to do, so I recommend before you run any samples, try an recipes, or work with your application, make sure to have the Developer Console running at all times.

How to run the Terracotta Developer Console


Running the Developer Console is easy. There are many ways depending on your context:

  • From the Welcome Application: Click the "Developer Console" link

  • From the command line: Run $TC_HOME/bin/dev-console.sh|bat

  • From Maven: Run $ mvn tc:dev-console

  • From Eclipse: Select Show Developer Console from the Terracotta menu.

Once you've got the Developer Console running, make sure to select the Connect automatically checkbox before connecting—this option will automatically connect the Developer Console to your cluster meaning you don't have to select "connect" every time you run a new cluster instance. This is very useful during experimentation (running sample demos and recipes) and integration testing.

Why should you run the Terracotta Developer Console?

We designed it so that you have access to a large array of information right at your fingertips. In particular, let's look at the user interface which is new in Terracotta 3.0:


One thing that I hope jumps out at you immediately is the presence of a new array of "speedo" dials - somewhat like the array of instruments that greets you when you step into the driver's seat of an automobile.

The resemblance isn't accidental. Those dials are there to give you up-to-the-second information about what's going on in the cluster - and to help pinpoint a problem - if there is one. Let's take a closer look:

Making use of the Speed Dials


As you can see, the dials are arrayed from left to right, giving you vital statistics about the cluster. The dials are separated into two groups:

  • Write Transacions

  • Impeding Factors

The Write Transactions dial contains a measure of the number of write transactions that are occurring in the system. Read transactions with Terracotta are exceedingly cheap (so cheap in fact that we don't measure them). Write transactions are a good measure of work being done in the cluster - so this measure is effectively a measure of how fast your application is running.

The Impeding Factors set of dials shows you a set of seven dials that show you statistics about other types of activity in the system. The activities displayed include such statistics as Object Creation Rate/s — the amount of new objects being added to the clustered heap per second — and Lock Recalls/s — the amount of lock requests that are being transferred from one client node to another.

Making use of the Runtime Statistics

Another very useful feature is the Runtime statistics panel. You can access this feature from the left menu tree by selecting the Runtime Statistics node.


The runtime statistics give you access to a wealth of realtime data with historical views. Unlike the Speedo Dials, the runtime statistics are kept for a longer period of time and graphed for you so you can see a historical view of how your application has been behaving.

Putting it all together

The Speed Dials give you instantaneous information - so they are visible all the time.

Look at the Write Transactions to measure your speed, and monitor the Impeding Factors to make sure nothing is slowing you down.

If there's something worth looking at in more detail, switch to the runtime statistics for more detailed information.

If there is a problem worth investigating, use the Diagnostics tools such as the Lock Profiler or Cluster Wide Thread Dump to debug further.

In other words ALWAYS RUN THE TERRACOTTA DEVELOPER CONSOLE!

Sunday, December 14, 2008

Simple Java Messaging

Following up on my recent post Java Distributed Lock Manager, sometimes you just need a simple way to pass messages between Java processes.

Messaging is a very useful pattern in Enterprise Integration, and there are many ways to do it. Apache Camel is a great tool when you need the flexibility and power to manage complex messaging patterns, including routing, filtering and the like.

If you just want to do something simple, though, that can be a challenge. The most common solution, JMS, requires quite a bit of boilerplate code, and requires selecting and running a JMS provider, which means selecting a J2EE container, Apache ActiveMQ, or others.

So what if you just want a drop-dead simple way of adding messaging to your application? Terracotta gives you that. (And also integrates well with other solutions, like Apache Camel if you need more power later on).

Simple messaging in Terracotta is built on the notion of clustering a LinkedBlockingQueue. Just as a LinkedBlockingQueue is used to pass messages between threads in a single JVM, it will be used in combination with Terracotta's JVM-level clustering to provide message passing between JVMs.

To demonstrate, here is a simple example.

import java.io.*;
import java.util.concurrent.*;
import java.util.concurrent.locks.*;

public class SimpleMessage
{
private static ReentrantReadWriteLock lock = new ReentrantReadWriteLock();
private static BlockingQueue<String> queue = new LinkedBlockingQueue<String>();

public static void receive() throws InterruptedException
{
System.out.println("Receiving messages...");
while (true) {
String msg = queue.take();
System.out.println("msg >> " + msg);
}
}

public static void send() throws Exception
{
while (true) {
System.out.print("Enter a message> "); System.out.flush();
String msg = new BufferedReader(new InputStreamReader(System.in)).readLine();
queue.put(msg);
}
}

public static void main(String[] args) throws Exception
{
// we use the presence of a lock to distinguish receiver from sender
if (lock.writeLock().tryLock()) {
receive();
} else {
send();
}
}
}
The app consist of two modes - a receiver mode and a sender mode. Normally, you would have an application specific mechanism of choosing whether you wanted to send messages or receive messages. For this example, we use a simple lock (for more information on using a ReentrantReadWriteLock with Terracotta, read the ReentrantReadWriteLock recipe). When free, the lock indicates no processes are receiving messages, so the process takes on the "receiver" mode. All subsequent processes take on the "sender" mode when the lock is held.

So let's run it with Terracotta and see how it works. First, we need to "cluster" the app. We need the lock and queue objects to be the same cluster-wide, which in Terracotta is called a root. So our Terracotta configuration file looks like:
<tc:tc-config xmlns:tc="http://www.terracotta.org/config"
xmlns:xsi="http://www.w3.org/2001/XMLSchema-instance"
xsi:schemaLocation="http://www.terracotta.org/schema/terracotta-4.xsd">

<application>
<dso>
<roots>
<root>
<field-name>SimpleMessage.lock</field-name>
</root>
<root>
<field-name>SimpleMessage.queue</field-name>
</root>
</roots>
</dso>
</application>
</tc:tc-config>
Now, let's run two JVMs with Terracotta. First, we start a server instance:
$ start-tc-server.sh
2008-12-14 10:26:18,246 INFO - Terracotta Server has started up as ACTIVE node on
0.0.0.0:9510 successfully, and is now ready for work.
Then, we start our JVMs.

JVM 1:
$ dso-java.sh SimpleMessage
Receiving Messages...
JVM 2:
$ dso-java.sh SimpleMessage
Enter a message>
Here, we enter a message, and see that it is printed in JVM 1:

JVM 2:
$ dso-java.sh SimpleMessage
Enter a message> hello world
JVM 1:
$ dso-java.sh SimpleMessage
Receiving Messages...
msg >> hello world
Further exploration

Try starting another JVM and see that they can both send messages to JVM 1. Try killing the receiver JVM and send messages to it. Then start another JVM. Since the lock is no longer held (Terracotta automatically releases any locks held by a JVM that exits the cluster) the new JVM will take on the receiver mode. Any messages sent while there was no receiver will have been queued, and will be printed on the startup of this new node.

And of course, you can see all the activity in the cluster. Try taking the receiver down again, send some messages using the sender nodes, then run the admin console. You'll be able to inspect the messages in the queue using the clustered heap browser.

This is just a demonstration of course - so to keep it simple I used a String as the message - but you could use any class.

For more fun with Terracotta, try the helpful "recipes" at Terracotta.org.

(Note, I've blogged about simple coordination in the past using Terracotta, which is similar)

Thursday, December 11, 2008

Java Distributed Lock Manager

Sometimes you just need a simple way to coordinate activities across more than one java process. There's a lot of choices out there. The database, JMX, distributed caches, JMS, filesystems. It would be nice if there was a simple, easy way to get distributed locks in a J2SE, J2EE, Web, SOAP, or AJAX application? There is.

Terracotta provides one of the easiest ways to get a distributed lock manager in your Java application. Terracotta plugs right in to normal Java threading constructs—synchronized, wait/notify, java.concurrent.locks.ReentrantReadWriteLock, and even java.concurrent.CyclicBarrier, which means you basically already know how to use Terracotta as a lock manager.

To demonstrate, let's work up a simple locking example and then drop Terracotta in. Our app will consist of acquiring a lock, "do some work" in a simple loop, and repeat. Here's the code (LockExample.java):

public class LockExample
{
private static Object lock = new Object();

public static void main(String[] args) throws Exception
{
while (true) {
System.out.print("Waiting for the lock..."); System.out.flush();
synchronized (lock) {
System.out.print("I got the lock, doing work");
for (int i = 0; i < 4; i++) {
Thread.currentThread().sleep(1000);
System.out.print("."); System.out.flush();
}
}
System.out.println("done");
}
}
}
Simple. If we run this on the command line, we get:
$ javac LockExample.java
$ java LockExample
Waiting for the lock...I got the lock, doing work....done
During the "work" part the "."'s are added 1 every second for four seconds. Fancy.

Let's add Terracotta. We need a tc-config.xml file which tells Terracotta how to provide the appropriate clustering behavior to our application:
<tc:tc-config xmlns:tc="http://www.terracotta.org/config"
xmlns:xsi="http://www.w3.org/2001/XMLSchema-instance"
xsi:schemaLocation="http://www.terracotta.org/schema/terracotta-4.xsd">

<application>
<dso>
<locks>
<autolock>
<method-expression>void LockExample.main(..)</method-expression>
</autolock>
</locks>
<roots>
<root>
<field-name>LockExample.lock</field-name>
</root>
</roots>
</dso>
</application>
</tc:tc-config>
Now, let's run two JVMs with Terracotta. First, we start a server instance:
$ start-tc-server.sh
2008-12-11 22:26:18,246 INFO - Terracotta Server has started up as ACTIVE node on
0.0.0.0:9510 successfully, and is now ready for work.
Then, we start our JVMs.

JVM 1:
$ dso-java.sh LockExample
Waiting for the lock...I got the lock, doing work....done
JVM 2:
$ dso-java.sh LockExample
Waiting for the lock...
It's a bit hard to demonstrate in a blog post, but the lock ping-pongs between the JVMs. That's it!

For more fun with distributed lock coordination, try these helpful "recipes":

Saturday, November 22, 2008

Sales 101: The 5 sales archetypes

There's a lot they don't teach you in school. As an engineer, most of the things I rely on day to day they never even so much as mentioned when I was in college, things like bug tracking, revision control, heck even writing error messages.

If you're an engineer, and in sales, it's even worse. I have spent the better half of my career in pre and post-sales as a "solutions architect" before moving on to product management. One thing that I have found to be useful is how to identify the person you are talking to on the other end of the phone.

I am not talking about figuring out if you are talking to a developer, a manager, an architect or a CEO. I mean what kind of person is this - what problems do they have, what kind of ego do they have, but most importantly, are they actually going to spend money. Like it or not, these considerations make a major contrbution to chances of your success.

So here's the 5 kinds of people you are most likely to meet, how to identify them, and what they mean to the bottom-line.

1. The beard-tugger

Summary: The beard-tugger thinks he is smarter than everyone else, and is committed to proving it. Thus he will spend the entire sales-pitch showing you just how smart he is.

Tell tale signs you have a beard-tugger: For every feature you talk about in your product, the beard-tugger will analyze it in 5 different ways and 10 different contexts. If he sees the slightest hole in your theory or implementation, he's bound to ask a question about it.

Pros: If you like to get into the guts of the product with someone, this is a great person to do it with. Remember though that if you are trying to sell this person, you need to let them "win" - e.g. never show them up to be lesser than the audience, or you risk losing them as a champion of your product.

Cons: There is no faster way to sink a pitch than to rat-hole on some minor detail of your product. The beard-tuggers middle name is rat-hole, so be careful.

2. The tire-kicker

Summary: The tire-kicker is out for a good time. They will take a sales call from anyone, and don't really have an agenda. They just want to see what you have. Often, this person thinks of themselves as "knowledgable about the market" so they will talk to you just to get a feel for your product to reinforce that feeling.

Tell tale signs you have a tire-kicker: if your product can be used in 10 different ways, he wants to know about every one of them. If you ask them about the specific problem they are looking to solve (and you should) the answer will be vague or none at all.

Pros: none really. This person may ultimately be a champion for you when they come around to solving a problem, so don't shun them. But you should get on with your life as soon as you can. Pitch your wares succinctly and move on.

Cons: big time suck. If you are not careful this person could come back time and time again, without a real problem to solve. That could be a big time sink for no real opportunity for business, in other words, a real waste of your time.

3. The science-experiment

Summary: Similar to the tire-kicker, but a little more involved, the science-experimenter is likely to have a problem in mind and wants to solve it, but there's generally no business behind it. This person is likely to be "exploring" technologies, but has picked yours as a likely candidate for a solution.

Tell tale signs you have a science-experiment: this person is allocating resources to a project to test out your product - e.g. run a POC (Proof of Concept). But if you press them, you will find there are no hard and fast requirements, so everything is either made up or guesswork. This person is likely to be enthusiastic both about their use case, and your product. They are probably even more enthusiastic about the opportunity for the mutual relationship to grow.

Pros: If you are successful, this could blossom into a sale, and the science-experimenter will probably tell you that at least 5 times in the span of 20 minutes.

Cons: A science-experiment goes nowhere 9 times out of 10. Stay away because there are no real requirements, and even if you succeed (which is unlikely, given the lack of a real requirement or business driver) there is unlikely to be a pot of gold at the end of this relationship, despite the claims of the science-experimenter to the contrary.

4. The delusional

Summary: This person is trying to use your product either for an outlandish use case, in an extreme way, or worse, in every possible way (e.g. they think you have the silver-bullet to every problem known to man).

Tell tale signs you have a person with delusions of grandeur on the line is that they will be obsessed with how successful their product will be. That is to say, they have either no product, or a very small product at the moment, and this person is most likely obsessed with the massive growth they are just about to incur.

Pros: None. This is one of the most dangerous people to engage with. Get out fast.

Cons: Very likely to be enthusiastic with your product and want to POC it. This is the most dangerous of people, because they will be pandering to your ego, which means you will be very easily swayed by them because they believe in you, and they love your product. They will spend a very long time in a POC with your product, because the requirements will likely be unrealistic bordering on ridiculous. If you bend to their whims, you will likely be adding features/fixing bugs that have no bearing on real business.

5. Your customer

Summary: This is the person you want to sell to. They have a business case, and likely some pain. When you discover what that pain is, you should have a product that solves that pain, for less money then they are currently spending.

Tell tale signs you are talking to your ideal customer: at the end of your initial call with this person, they should have asked you how much your product costs, and they should be wary that your product can actually solve their problem (afterall, nothing else has to date), but be slightly optimistic that maybe you can solve their problem, and be willing to try. They should have a use case that is within the bounds of what your product can solve, and they should be interested in what the next steps are after the call.

Pros: Sell them quickly - this is where you should be spending your time.

Cons: None - your only challenge is to identify this person. If you don't, you're losing money.

Now, go out there and make some money! :)