With the release of Terracotta 3.0, I hope many of you have or are considering checking out Terracotta to see if it can help with scalability and availability of your Java application.
Of course www.terracotta.org - in particular the tutorials section with many simple recipes for exploring the many uses of Terracotta is a good place to get started.
But before you do any of that, I'd like to point out a best practice for learning and working with Terracotta. So, here's my tip for whenever you are working with Terracotta:
TIP: ALWAYS RUN THE TERRACOTTA DEVELOPER CONSOLEIt's easy to do, so I recommend before you run any samples, try an recipes, or work with your application, make sure to have the Developer Console running at all times.
How to run the Terracotta Developer Console
Running the Developer Console is easy. There are many ways depending on your context:
- From the Welcome Application: Click the "Developer Console" link
- From the command line: Run
$TC_HOME/bin/dev-console.sh|bat
- From Maven: Run
$ mvn tc:dev-console
- From Eclipse: Select
Show Developer Console from the Terracotta menu.
Once you've got the Developer Console running, make sure to select the
Connect automatically checkbox before connecting—this option will automatically connect the Developer Console to your cluster meaning you don't have to select "connect" every time you run a new cluster instance. This is very useful during experimentation (running sample demos and recipes) and integration testing.
Why should you run the Terracotta Developer Console?
We designed it so that you have access to a large array of information right at your fingertips. In particular, let's look at the user interface which is new in Terracotta 3.0:
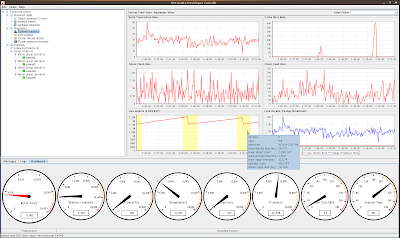
One thing that I hope jumps out at you immediately is the presence of a new array of "speedo" dials - somewhat like the array of instruments that greets you when you step into the driver's seat of an automobile.
The resemblance isn't accidental. Those dials are there to give you up-to-the-second information about what's going on in the cluster - and to help pinpoint a problem - if there is one. Let's take a closer look:
Making use of the Speed Dials
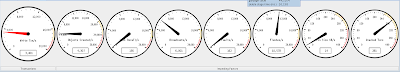
As you can see, the dials are arrayed from left to right, giving you vital statistics about the cluster. The dials are separated into two groups:
- Write Transacions
- Impeding Factors
The
Write Transactions dial contains a measure of the number of write transactions that are occurring in the system. Read transactions with Terracotta are exceedingly cheap (so cheap in fact that we don't measure them). Write transactions are a good measure of work being done in the cluster - so this measure is effectively a measure of how fast your application is running.
The
Impeding Factors set of dials shows you a set of seven dials that show you statistics about other types of activity in the system. The activities displayed include such statistics as
Object Creation Rate/s — the amount of new objects being added to the clustered heap per second — and
Lock Recalls/s — the amount of lock requests that are being transferred from one client node to another.
Making use of the Runtime Statistics
Another very useful feature is the Runtime statistics panel. You can access this feature from the left menu tree by selecting the
Runtime Statistics node.
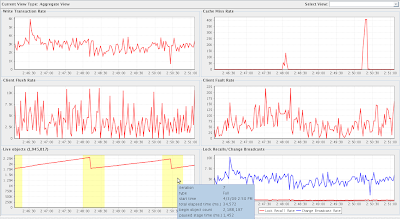
The runtime statistics give you access to a wealth of realtime data with historical views. Unlike the Speedo Dials, the runtime statistics are kept for a longer period of time and graphed for you so you can see a historical view of how your application has been behaving.
Putting it all together
The Speed Dials give you instantaneous information - so they are visible all the time.
Look at the
Write Transactions to measure your speed, and monitor the
Impeding Factors to make sure nothing is slowing you down.
If there's something worth looking at in more detail, switch to the runtime statistics for more detailed information.
If there is a problem worth investigating, use the
Diagnostics tools such as the
Lock Profiler or
Cluster Wide Thread Dump to debug further.
In other words
ALWAYS RUN THE TERRACOTTA DEVELOPER CONSOLE!


